Discrete Sets
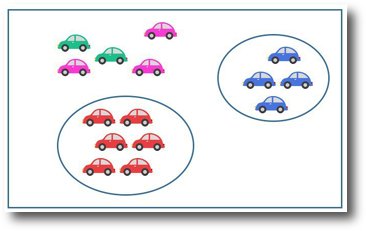
To begin with, children will naturally classify into separate sets or collections – for example putting together all the cows from a box of toy farm animals or sorting boys and girls in a class. Sets that do not overlap and have no members in common are called discrete sets. It is from sorting and classifying discrete sets that the idea of non-numerical and numerical comparison of a set develops, as shown in the example on the right.
The defining of sets is important so that it is clear to children what makes up the members of that set. ‘Does that car belong to the set?’ should be a binary answer – yes or no. The rules given for the sort can be simple, single criteria through to as many as is sensible, but the important thing is to make sure the children can take an object, shape or number and know through asking ‘Does it belong to the set?’ whether it does or does not. If it does not belong in the set, then it is a complement of the set.
Representing sets
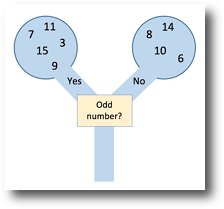
Carroll diagrams, Venn diagrams and sorting (or decision) trees are the most commonly used sorting models for distinguishing objects that are members of the set from those that are a complement of the set.
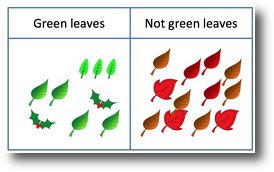
Carroll diagrams, named after Charles Dodgson (Lewis Carroll), are possibly the simplest starting point for sorting. If, for example some leaves are put on a table to sort, children will naturally put one type of leaf on one side of the table and the others on the other side. These can then be labelled as, for example, ‘green leaves’ and ‘not green leaves’ with a line put down the centre to separate the sets. The use of the word ‘not’ reinforces the logic involved in sorting.
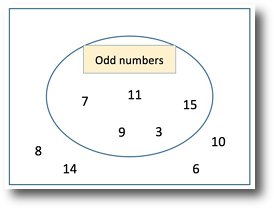
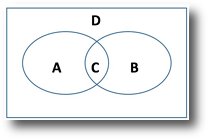
Venn diagrams, first used by the 19th century philosopher John Venn, are another type of representation for sorting by one or more attribute. Loops are drawn to hold items with the same attribute, with items that are not part of that set put outside the loop. Importantly, a rectangle is put around the loop to hold all the items, termed the universal set. It is important because it shows the limit of the items that have been classified and sorted.
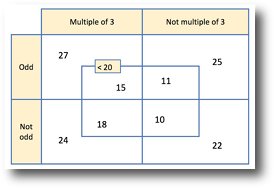
For example, this Venn diagram shows the set of odd numbers from the range of numbers given. The universal set shows that we ignore all the other numbers that could be sorted.
More than one attribute
As they develop their skills of classification and their ability to think logically, children will move onto sorting using more than one attribute.
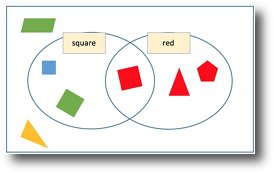
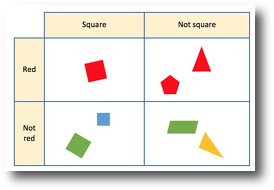
They can, for example, sort a pile of shapes into a set of red shapes and a set of squares and so need to then classify shapes that are both red and square. Venn and Carroll diagrams are useful models for this and it always good to compare the regions of each diagram.
- Where is the intersecting set on the Venn and Carroll diagram?
- Where is the outside set or complement on the Venn and Carroll diagrams?
- How many shapes are there altogether that are red and that are square?
This last question identifies the union of sets rather than the intersection and is useful for finding the total number of items when the sets are combined.
This use of sorting diagrams helps build up the language of logical thought and also simple computer programming:
The red square goes here because it is red AND square
The red triangle goes here because it is red and it is NOT a square
The green parallelogram goes here because it is NEITHER red NOR a square
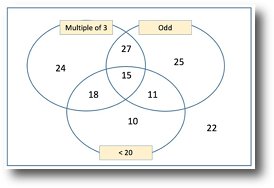
Three attribute sorting is particularly clever when you look at the Carroll diagram.
Compare both diagrams and ask ‘What is this the set of?’ for each region.
Subsets
An aspect of sorting that is sometimes missed is the use of subsets to classify items.
Using the language ‘the set of…’ (this is a pair of curly brackets { } in higher mathematics) is helpful in determining the attributes of a set.
For example:
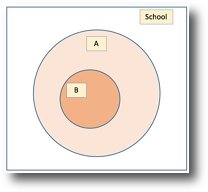
A is the set of children in Class 2 B is the set of children in Class 2 who wear glasses
A = {children in Class 2} B = {children in Class 2 who wear glasses}
The relation between two sets and whether one is included in another is fundamentally important when exploring the properties of objects, shapes and numbers. For example, ask children to draw a Venn diagram to sort quadrilaterals to show that all squares are rectangles but not all rectangles are squares. Venn diagrams with intersecting sets or subsets may be used and it is interesting to then compare this to a Carroll diagram showing the same information.
I have always enjoyed using sorting diagrams with a class as a way of refining their understanding through language and logic. I would recommend using Venn and Carroll diagrams alongside each other with the same data so they can be compared. Rules can be given (or not) and sets shown (or not) to determine the rules – all leading very nicely towards children exploring and thinking mathematically.
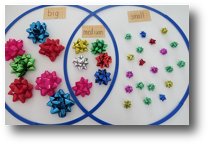
I was looking at an educational resources website and came across this activity. The purpose was to sort objects into groups based on size.
However, this shows the incorrect use of a Venn diagram, as the intersecting set does not show shapes that are both large and small, they are medium! How confusing for children. To sort into 3 groups, there should be 3 separate sets (circles).
If they wanted an intersecting set there could be, for example, two sets of small and blue. The large and medium not-blue objects would be positioned in the outer section (this didn't have an outer section/rectangle either).


