Just as you wouldn’t have a separate unit of maths on ‘Language’, I think that tables, charts, graphs and diagrams all give opportunities to add a context to your teaching of number, calculations, fractions, geometry and measures.
Bath Time Graph Stories
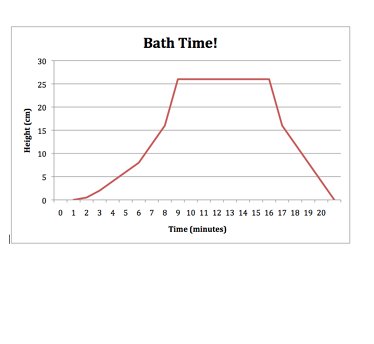
Try this maths activity based on the graph to the right. It is an old favourite of mine and appropriate for Years 4-6, linking very nicely to a unit with ‘Time’ as a focus. A good way to introduce the continuous nature of line graphs is to model one based on water filling a bath.
• Start with no title or label and ask the class what they think it shows – anything is possible.
• Then put on the labels and ask them to try to tell the story of the line graph as talk partners.
Tip : Make sure you talk about the scale on the axes and how this could change the picture, but not the story.
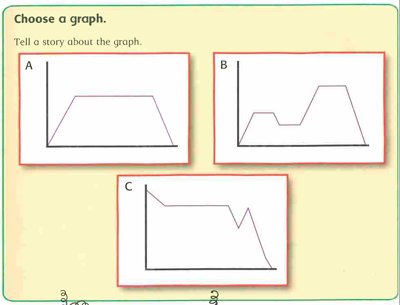
Now get your children to have a go at a making up their own graph stories from any blank graph. They can decide the information their graph is showing.
Draw your own graphs like the ones to the left, or use a copy of these from this file:
For Broadbent Maths users there is a detailed Small Steps of Progression Chart and to help with planning and record keeping I have also provided a data handling record sheet, which will certainly help.
You need to just make sure that you have that balance of breadth and depth (as usual) when planning data handling tasks, using the full range of graphs, charts, tables and charts for children to use and explore.


